

I own an Fortigate 40F firewall and with SNMP it is possible to add sensors in Home Assistant. I did the same with the Untangle firewall, which i owned previously.
First of all enable SNMP in the Fortigate Firewall under System \ SNMP. Make sure you enable SNMPv2c and add you Home Assistant IP address as a trusted Host. Only ‘accept queries’ is enough to read the sensor data. SNMPv1 can be disabled.
Make sure SNMP is also enabled on the LAN interface from where you connect in the Fortigate.
I am using the follow configuration in sensor.yaml. Change your secrets to your own secrets.
  - platform: snmp
    name: 'Firewall Firmware Version'
    host: !secret firewall_ip
    baseoid: 1.3.6.1.4.1.12356.101.4.1.1.0
    community: !secret firewall_snmp_community
    value_template: "{{ value.split(',')[0] }}"
    version: '2c'
    scan_interval: 60
  - platform: snmp
    name: 'Firewall Uptime'
    host: !secret firewall_ip
    baseoid: 1.3.6.1.2.1.1.3.0
    community: !secret firewall_snmp_community
    version: '2c'
    scan_interval: 60
    value_template: >-
      {% set time = (value | int) | int %}
      {% set minutes = ((time % 360000) / 6000) | int%}
      {% set hours = ((time % 8640000) / 360000) | int %}
      {% set days = (time / 8640000) | int %}
        {%- if time < 60 -%}
          Less then 1 min
          {%- else -%}
          {%- if days > 0 -%}
            {{ days }}d
          {%- endif -%}
          {%- if hours > 0 -%}
            {%- if days > 0 -%}
              {{ ' ' }}
            {%- endif -%}
            {{ hours }}hr
          {%- endif -%}
          {%- if minutes > 0 -%}
            {%- if days > 0 or hours > 0 -%}
              {{ ' ' }}
            {%- endif -%}
            {{ minutes }}min
          {%- endif -%}
        {%- endif -%}
  - platform: snmp
    name: 'Firewall WAN In'
    host: !secret firewall_ip
    baseoid: 1.3.6.1.2.1.2.2.1.10.1
    community: !secret firewall_snmp_community
    version: '2c'
    scan_interval: 60
  - platform: snmp
    name: 'Firewall WAN Out'
    host: !secret firewall_ip
    baseoid: 1.3.6.1.2.1.2.2.1.16.1
    community: !secret firewall_snmp_community
    version: '2c'
    scan_interval: 60
  - platform: derivative
    name: 'Firewall WAN In Stats'
    source: sensor.firewall_wan_in
    unit_time: s
    unit: B
  - platform: derivative
    name: 'Firewall WAN Out Stats'
    source: sensor.firewall_wan_out
    unit_time: s
    unit: B
  - platform: template
    sensors:
      firewall_internet_in_mbps:
        value_template:  "{{ [((states('sensor.firewall_wan_in_stats')|float(none)*8)/1000000)|round(2, default=none),0]|max }}"
        unit_of_measurement: 'MBps'
      firewall_internet_out_mbps:
        value_template:  "{{ [((states('sensor.firewall_wan_out_stats')|float(none)*8)/1000000)|round(2, default=none),0]|max }}"
        unit_of_measurement: 'MBps'
  - platform: snmp
    name: 'Firewall CPU Used Percentage'
    host: !secret firewall_ip
    baseoid: 1.3.6.1.4.1.12356.101.4.1.3.0
    community: !secret firewall_snmp_community
    version: '2c'
    value_template: '{{ value | float }}'
    unit_of_measurement: '%'
    scan_interval: 60
  - platform: snmp
    name: 'Firewall Memory Used Percentage'
    host: !secret firewall_ip
    baseoid: 1.3.6.1.4.1.12356.101.4.1.4.0
    community: !secret firewall_snmp_community
    version: '2c'
    value_template: '{{ value | float }}'
    unit_of_measurement: "%"
    scan_interval: 60
  - platform: snmp
    name: 'Firewall Session Count'
    host: !secret firewall_ip
    baseoid: 1.3.6.1.4.1.12356.101.4.1.8.0
    community: !secret firewall_snmp_community
    version: '2c'
    value_template: '{{ value | float }}'
    scan_interval: 60
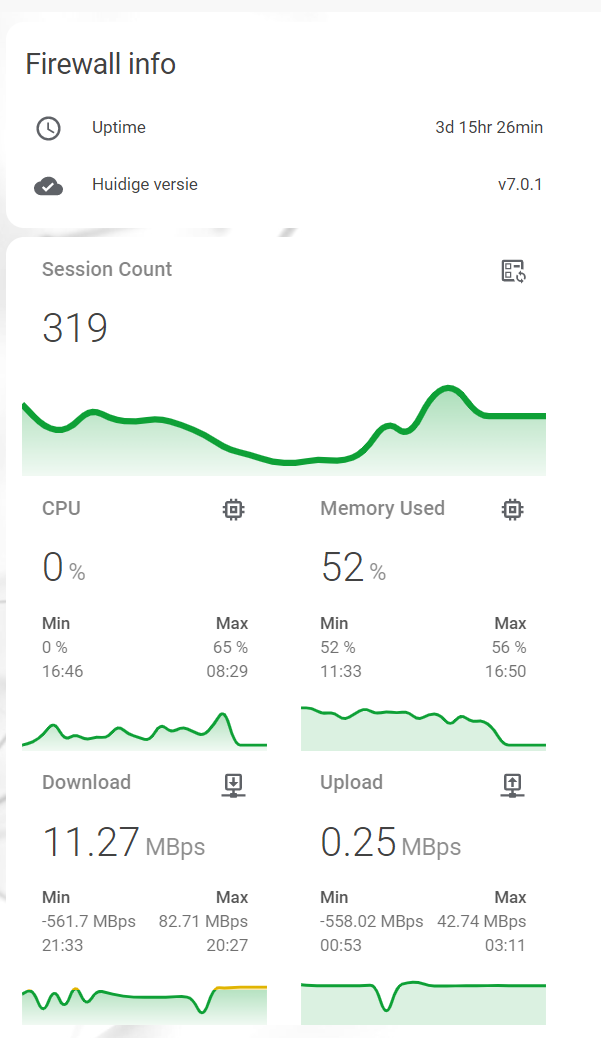
and if you like you can create a nice lovelace dashboard. I do have some customization in this card for my theme, but you can change this if you like.
 - type: entities
   style: |
    ha-card {
       box-shadow: var(--card-box-shadow);
       margin: 0px 14px 0px 14px;
     }
   show_header_toggle: false
   title: Firewall info
   entities:
     - entity: sensor.firewall_uptime
       name: Uptime
     - entity: sensor.firewall_firmware_version
       name: Huidige versie
       icon: mdi:cloud-check
 - type: 'custom:vertical-stack-in-card'
   style: |
    ha-card {
       box-shadow: var(--card-box-shadow);
       margin: 0px 14px 0px 14px;
     }
   cards:
   - type: 'custom:mini-graph-card'
     style: |
      ha-card {
         box-shadow: var(--card-box-shadow);
         margin: 0px 14px 0px 14px;
       }
     name: Session Count
     color_thresholds:
       - color: '#e45e65'
         value: 600
       - color: '#e0b400'
         value: 400
       - color: '#0da035'
         value: 0
     color_thresholds_transition: hard
     entities:
       - sensor.firewall_session_count
     group: false
     hour24: true
     line_width: 6
     points_per_hour: 1
     show:
       extrema: false
       fill: fade
       icon: true
       labels: false
       name: true
       state: true
   - type: horizontal-stack
     style: |
      ha-card {
         box-shadow: var(--card-box-shadow);
         margin: 0px 14px 0px 14px;
       }
     cards:
     - type: 'custom:mini-graph-card'
       style: |
        ha-card {
           box-shadow: var(--card-box-shadow);
           margin: 0px 14px 0px 14px;
         }
       name: CPU
       color_thresholds:
         - color: '#e45e65'
           value: 50
         - color: '#e0b400'
           value: 20
         - color: '#0da035'
           value: -1
       color_thresholds_transition: hard
       entities:
         - sensor.firewall_cpu_used_percentage
       group: false
       hour24: true
       line_width: 6
       points_per_hour: 1
       show:
         extrema: true
         fill: fade
         icon: true
         labels: false
         name: true
         state: true
     - type: 'custom:mini-graph-card'
       style: |
        ha-card {
           box-shadow: var(--card-box-shadow);
           margin: 0px 14px 0px 14px;
         }
       name: Memory Used
       color_thresholds:
         - color: '#e45e65'
           value: 80
         - color: '#e0b400'
           value: 60
         - color: '#0da035'
           value: 20
       color_thresholds_transition: hard
       entities:
         - sensor.firewall_memory_used_percentage
       group: false
       hour24: true
       line_width: 6
       points_per_hour: 1
       show:
         extrema: true
         icon: true
         labels: false
         name: true
       state: true
   - type: horizontal-stack
     style: |
      ha-card {
         box-shadow: var(--card-box-shadow);
         margin: 0px 14px 0px 14px;
       }
     cards:
       - type: 'custom:mini-graph-card'
         style: |
          ha-card {
             box-shadow: var(--card-box-shadow);
             margin: 0px 14px 0px 14px;
           }
         name: Download
         color_thresholds:
           - color: '#e45e65'
             value: 10
           - color: '#e0b400'
             value: 5
           - color: '#0da035'
             value: -1
         color_thresholds_transition: hard
         entities:
           - sensor.firewall_internet_in_mbps
         group: false
         hour24: true
         line_width: 6
         points_per_hour: 1
         show:
           extrema: true
           fill: fade
           icon: true
           labels: false
           name: true
           state: true
       - type: 'custom:mini-graph-card'
         style: |
          ha-card {
             box-shadow: var(--card-box-shadow);
             margin: 0px 14px 0px 14px;
           }
         name: Upload
         color_thresholds:
           - color: '#e45e65'
             value: 2
           - color: '#e0b400'
             value: 1
           - color: '#0da035'
             value: -1
         color_thresholds_transition: hard
         entities:
           - sensor.firewall_internet_out_mbps
         group: false
         hour24: true
         line_width: 6
         points_per_hour: 1
         show:
           extrema: true
           icon: true
           labels: false
           name: true
         state: true
The result 🙂
Great tutorial! Used it for my Fortigate 60F currently running on 6.4.7
Have you seen that there are negative values in Download and Upload for the “Min” values? Any clue what’s the cause and how to fix it?
Not really. Funny thing is that I can’t get it working any more. Home assistant is hanging getting the snmp sensor data from the Fortigate. When I have time I will dive into it.
Mine is running with SNMPv3, if you need some help you have my mail address 😉
Just implemented your script. Works fine only not the wan interface speed.
Did you find the correct OID? Looking with a buddy of mine as wel to find it.
No sorry, didnt find it, my snmp is not giving any values at the moment, didnt get the time to check it out 🙂
I updated the code for use in ha 2021.11 and (default) values and modified the statistics sensors to derivative. Looks a lot better now. Try again