
I own an Untangle firewall and with SNMP it is possible to add sensors in Home Assistant.
First of all enable SNMP in the Untangle Firewall under Config \ Administration \ SNMP.
Enable SNMP Monitoring and fill in your Community String.
I am using the follow configuration in sensor.yaml. Change your secrets to your own secrets.
- platform: snmp
    name: 'Firewall WAN In'
    host: !secret firewall_ip
    baseoid: 1.3.6.1.2.1.31.1.1.1.6.3
    community: !secret firewall_snmp_community
    version: '2c'
    scan_interval: 60
  - platform: snmp
    name: 'Firewall WAN Out'
    host: !secret firewall_ip
    baseoid: 1.3.6.1.2.1.31.1.1.1.10.3
    community: !secret firewall_snmp_community
    version: '2c'
    scan_interval: 60
  - platform: statistics
    name: 'Firewall WAN In Stats'
    entity_id: sensor.firewall_wan_in
    sampling_size: 4
    max_age:
      hours: 24
  - platform: statistics
    name: 'Firewall WAN Out Stats'
    entity_id: sensor.firewall_wan_out
    sampling_size: 4
    max_age:
      hours: 24
  - platform: template
    sensors:
      firewall_internet_in_mbps:
        value_template: "{{ (state_attr('sensor.firewall_wan_in_stats','change_rate')|float*8*(state_attr('sensor.firewall_wan_in_stats', 'sampling_size')-1)/1000000)|round(2) }}"
        unit_of_measurement: 'MBps'
    #    entity_id: sensor.firewall_wan_in_stats
      firewall_internet_out_mbps:
        value_template: "{{ (state_attr('sensor.firewall_wan_out_stats','change_rate')|float*8*(state_attr('sensor.firewall_wan_out_stats', 'sampling_size')-1)/1000000)|round(2) }}"
        unit_of_measurement: 'MBps'
     #   entity_id: sensor.firewall_wan_out_stats
  - platform: snmp
    name: 'Firewall Uptime'
    host: !secret firewall_ip
    baseoid: 1.3.6.1.2.1.25.1.1.0
    community: !secret firewall_snmp_community
    version: '2c'
    scan_interval: 60
    value_template: >-
      {% set time = (value | int) | int %}
      {% set minutes = ((time % 360000) / 6000) | int%}
      {% set hours = ((time % 8640000) / 360000) | int %}
      {% set days = (time / 8640000) | int %}
        {%- if time < 60 -%}
          Less then 1 min
          {%- else -%}
          {%- if days > 0 -%}
            {{ days }}d
          {%- endif -%}
          {%- if hours > 0 -%}
            {%- if days > 0 -%}
              {{ ' ' }}
            {%- endif -%}
            {{ hours }}hr
          {%- endif -%}
          {%- if minutes > 0 -%}
            {%- if days > 0 or hours > 0 -%}
              {{ ' ' }}
            {%- endif -%}
            {{ minutes }}min
          {%- endif -%}
        {%- endif -%}
  - platform: snmp
    name: 'Firewall CPU 5min'
    host: !secret firewall_ip
    baseoid: 1.3.6.1.4.1.2021.10.1.3.2
    community: !secret firewall_snmp_community
    version: '2c'
    value_template: '{{ value | float }}'
    unit_of_measurement: '%'
    scan_interval: 60
  - platform: snmp
    name: 'Firewall Memory Used GB'
    host: !secret firewall_ip
    baseoid: 1.3.6.1.4.1.2021.4.6.0
    community: !secret firewall_snmp_community
    version: '2c'
    value_template: '{{ (value | float /1024 /1024) | round(1) }}'
    unit_of_measurement: 'GB'
    scan_interval: 60
  - platform: snmp
    name: 'Firewall Version'
    host: !secret firewall_ip
    baseoid:  1.3.6.1.2.1.25.6.3.1.2.784
    community: !secret firewall_snmp_community
    version: '2c'
    value_template: "{{ value.split('-')[3].split('.')[0:3]|join('.') }}"
    scan_interval: 3600
and if you like you can add a sensor for the last version from Untangle, so you can create alerts. This is a scrape sensor:
- platform: scrape
name: firewall_available_version
resource: https://wiki.untangle.com/index.php/Date_Changelog
select: ".toctext"
scan_interval: 3600
value_template: "{{ value.split(' ')[0] }}"
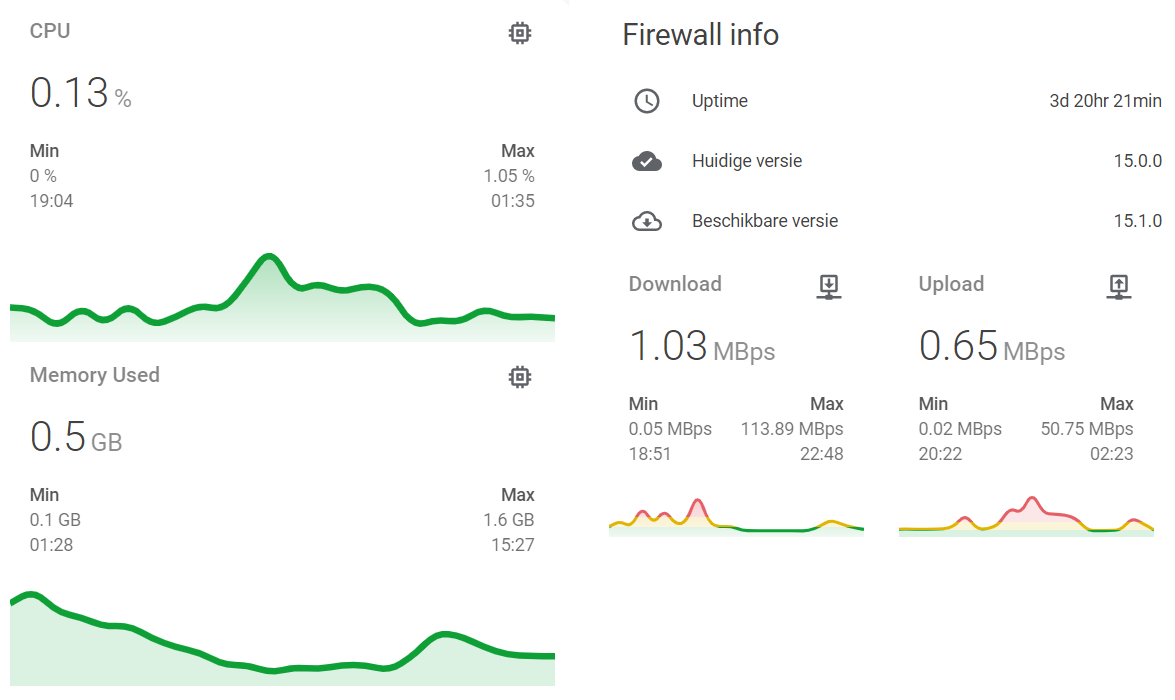
verify_ssl: trueand if you like you can create a nice lovelace dashboard. I do have some customization in this card for my theme, but you can change this if you like.
- type: entities
   style: |
    ha-card {
       box-shadow: var(--card-box-shadow);
       margin: 0px 14px 0px 14px;
     }
   show_header_toggle: false
   title: Firewall info
   entities:
     - entity: sensor.firewall_uptime
       name: Uptime
     - entity: sensor.firewall_version
       name: Huidige versie
       icon: mdi:cloud-check
     - entity: sensor.firewall_available_version
       name: Beschikbare versie
       icon: mdi:cloud-download-outline
 - type: 'custom:vertical-stack-in-card'
   style: |
    ha-card {
       box-shadow: var(--card-box-shadow);
       margin: 0px 14px 0px 14px;
     }
   cards:
   - type: 'custom:mini-graph-card'
     style: |
      ha-card {
         box-shadow: var(--card-box-shadow);
         margin: 0px 14px 0px 14px;
       }
     name: CPU
     color_thresholds:
       - color: '#e45e65'
         value: 1.5
       - color: '#e0b400'
         value: 0.5
       - color: '#0da035'
         value: -1
     color_thresholds_transition: hard
     entities:
       - sensor.firewall_cpu_5min
     group: false
     hour24: true
     line_width: 6
     points_per_hour: 1
     show:
       extrema: true
       fill: fade
       icon: true
       labels: false
       name: true
       state: true
   - type: 'custom:mini-graph-card'
     style: |
      ha-card {
         box-shadow: var(--card-box-shadow);
         margin: 0px 14px 0px 14px;
       }
     name: Memory Used
     color_thresholds:
       - color: '#e45e65'
         value: 3.5
       - color: '#e0b400'
         value: 2.8
       - color: '#0da035'
         value: -1
     color_thresholds_transition: hard
     entities:
       - sensor.firewall_memory_used_gb
     group: false
     hour24: true
     line_width: 6
     points_per_hour: 1
     show:
       extrema: true
       icon: true
       labels: false
       name: true
     state: true
   - type: horizontal-stack
     style: |
      ha-card {
         box-shadow: var(--card-box-shadow);
         margin: 0px 14px 0px 14px;
       }
     cards:
       - type: 'custom:mini-graph-card'
         style: |
          ha-card {
             box-shadow: var(--card-box-shadow);
             margin: 0px 14px 0px 14px;
           }
         name: Download
         color_thresholds:
           - color: '#e45e65'
             value: 10
           - color: '#e0b400'
             value: 5
           - color: '#0da035'
             value: -1
         color_thresholds_transition: hard
         entities:
           - sensor.firewall_internet_in_mbps
         group: false
         hour24: true
         line_width: 6
         points_per_hour: 1
         show:
           extrema: true
           fill: fade
           icon: true
           labels: false
           name: true
           state: true
       - type: 'custom:mini-graph-card'
         style: |
          ha-card {
             box-shadow: var(--card-box-shadow);
             margin: 0px 14px 0px 14px;
           }
         name: Upload
         color_thresholds:
           - color: '#e45e65'
             value: 2
           - color: '#e0b400'
             value: 1
           - color: '#0da035'
             value: -1
         color_thresholds_transition: hard
         entities:
           - sensor.firewall_internet_out_mbps
         group: false
         hour24: true
         line_width: 6
         points_per_hour: 1
         show:
           extrema: true
           icon: true
           labels: false
           name: true
         state: true
The result 🙂