

I was searching for a good way to get a nice dashboard for my
D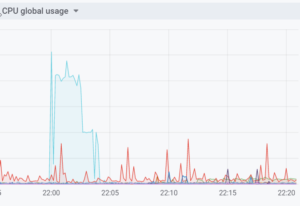 ocker Containers. In my first try i made use of a custom component docker_monitor in
Home Assistant. It was working, but sending such a tremendous amount of data to the Home Assistant internal Db that it was growing very fast, which was far from ideal. So i created it in Grafana with help of Telegraf, InfluxDb and made an iFrame in Home Assistant to view the data.
First of all create the InfluxDb container with docker-compose:
influxdb:
    container_name: InfluxDB
    image: influxdb:latest
    restart: always
    network_mode: host
    ports:
      - 8083:8083
      - 8086:8086
    volumes:
      - /home/docker/influxdb:/var/lib/influxdb
    labels:
      - com.centurylinklabs.watchtower.enable=true
Login into the docker container by: sudo docker exec -it InfluxDB /bin/bash
Create a new database by running ‘influx’ and then:
CREATE DATABASE DockerDB (or another name)
With ‘SHOW DATABASES’ you can view that the database is created correctly. Type ‘exit’ and another ‘exit’.
Create the Telegraf container with docker-compose:
telegraf:
    image: telegraf:latest
    hostname: telegraf
    container_name: telegraf
    depends_on:
      - influxdb volumes: - /var/run/docker.sock:/var/run/docker.sock - /home/docker/telegraf/telegraf.conf:/etc/telegraf/telegraf.conf labels: - com.centurylinklabs.watchtower.enable=true
Within the folder mapping there is an telegraf.conf file, i put in the following content:
# # Read metrics about docker containers
[[inputs.docker]]
  ## Docker Endpoint
  ## To use TCP, set endpoint = "tcp://[ip]:[port]"
  ## To use environment variables (ie, docker-machine), set endpoint = "ENV"
  endpoint = "unix:///var/run/docker.sock"
  ## Only collect metrics for these containers, collect all if empty
  container_names = []
  ## Timeout for docker list, info, and stats commands
  timeout = "5s"
  ## Whether to report for each container per-device blkio (8:0, 8:1...) and
  ## network (eth0, eth1, ...) stats or not perdevice = true
  ## Whether to report for each container total blkio and network stats or not
  total = false

# Configuration for influxdb server to send metrics to
[[outputs.influxdb]]
 ## The full HTTP or UDP endpoint URL for your InfluxDB instance.
 ## Multiple urls can be specified as part of the same cluster,
 ## this means that only ONE of the urls will be written to each interval.
 # urls = ["udp://localhost:8089"] # UDP endpoint example
 urls = ["http://127.0.0.1:8086"] # required
 ## The target database for metrics (telegraf will create it if not exists).
 database = "DockerDB" # required
 ## Retention policy to write to. Empty string writes to the default rp.
 retention_policy = ""
 ## Write consistency (clusters only), can be: "any", "one", "quorum", "all"
 write_consistency = "any"
 ## Write timeout (for the InfluxDB client), formatted as a string.
 ## If not provided, will default to 5s. 0s means no timeout (not recommended).
 timeout = "5s"
 # username = "telegraf"
 # password = "metricsmetricsmetricsmetrics"
 ## Set the user agent for HTTP POSTs (can be useful for log differentiation)
 # user_agent = "telegraf"
 ## Set UDP payload size, defaults to InfluxDB UDP Client default (512 bytes)
 # udp_payload = 512
You can fill in urls and databasefrom your own needs.
At last we create the Grafana container:
grafana:
    container_name: Grafana
    image: grafana/grafana:latest
    restart: always
    network_mode: host
    ports:
      - 3000:3000
    depends_on:
      - influxdb
      - telegraf
    volumes:
      - /home/docker/grafana:/var/lib/grafana
    user: root
    labels:
      - com.centurylinklabs.watchtower.enable=true
Now you can open your Grafana from Http://yourip:3000 and configure it.
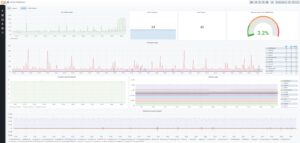
Withtin Grafana create a Import a new Dashboard and choose 1150 af the number.
Choose a folder, a name and your database.
You get a nice Docker Dashboard.
To get is in Home Assistant you will have to edit the grafana.ini witch is in the grafana container. So open up the container by sudo docker exec -it InfluxDB /bin/bash
and give in:
apk update
apk add nano
cd /etc/grafana
nano grafana.ini
edit the following rows:
[auth] disable_login_form = true
 ......
[auth.anonymous] enabled = true
.......
org_name = JustYourOrgName
.......
Reboot Grafana.
Now add the following in Home Assistant:
panel_iframe:
  grafana:
    title: Grafana
    icon: mdi:chart-timeline
    url: 'https://theurl-to-the-dashboard'
The URL has to be HTTPS if you run Home Assistant in HTTPS. So the best thing to do is create it in Traefik as an url, then it will be HTTPS.